Imagine this: a shopper lands on your store from a Google ad. They browse a product, read the reviews, scroll back up, hover over “Add to Cart,” and leave.
Was the price too high? Did shipping costs put them off? Did they miss important product information? You can probably think of a dozen possible explanations. The problem is that they’re all just guesses.
Traditional analytics can tell you where customers entered your site, which pages they visited, and where they dropped off. What they can’t show is how people interacted with the page before making that decision.
That’s why heatmaps and session recordings have become essential conversion rate optimization tools for e-commerce teams. But there’s a catch. Heatmaps and session recordings are designed to answer different questions, and knowing when to use each one is very important for e-commerce teams.
Traditional analytics tell you what happened, not why
Every e-commerce team relies on analytics. Whether it’s GA4, Adobe Analytics, or Shopify reports, these tools are excellent at measuring what happened in your store.
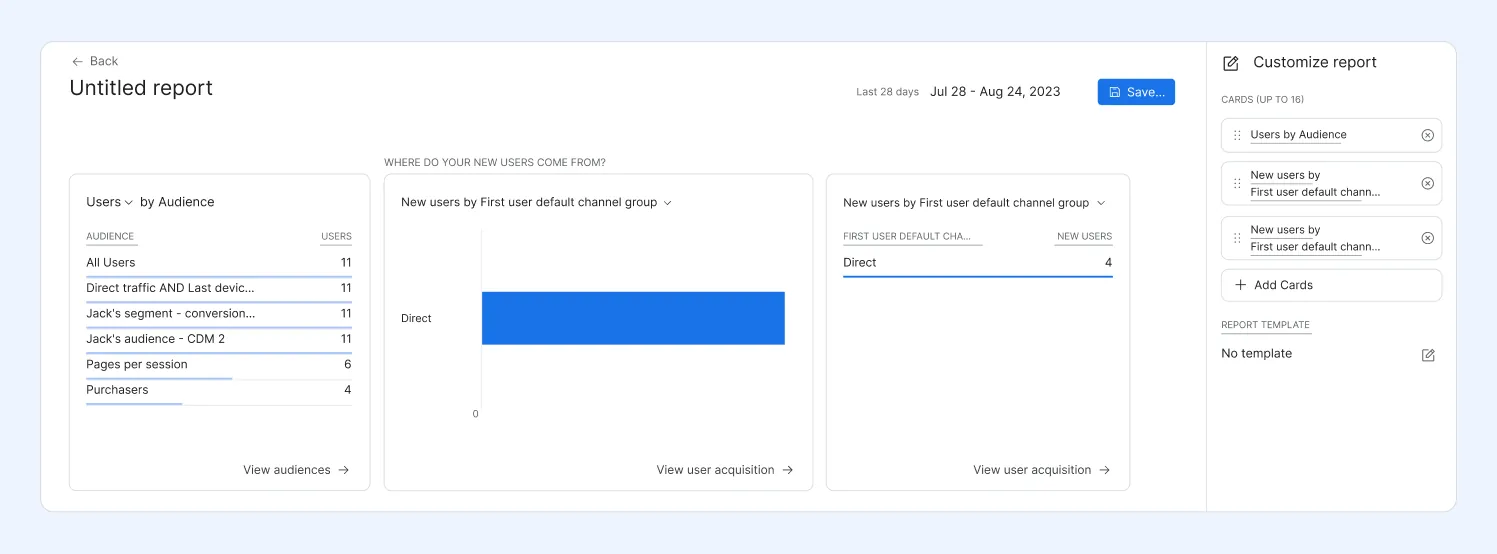
An example of a GA4 analytics report showing e-commerce traffic sources and audiences.
They can tell you which channels drive the most traffic, where customers enter your site, how many add products to their cart, and exactly where they abandon the purchase journey. But numbers rarely explain behavior.
Let’s say your product page has a healthy amount of traffic but a disappointing conversion rate. Analytics can confirm that visitors are leaving without making a purchase. It can’t tell you whether they struggled to find the size guide, overlooked your shipping information, or simply got distracted before adding the product to their cart.
The same is true for checkout. A high abandonment rate might point to unexpected shipping costs, payment issues, or a technical bug. Without seeing how customers interacted with the page, every explanation is just another hypothesis. This is where behavioral analytics comes in.
Instead of focusing only on clicks, sessions, and conversion rates, behavioral analytics helps you understand how people actually experience your store. Heatmaps and session recordings are two of the most widely used behavioral analytics tools. While both help uncover customer behavior, they do it in very different ways.
What are heatmaps?
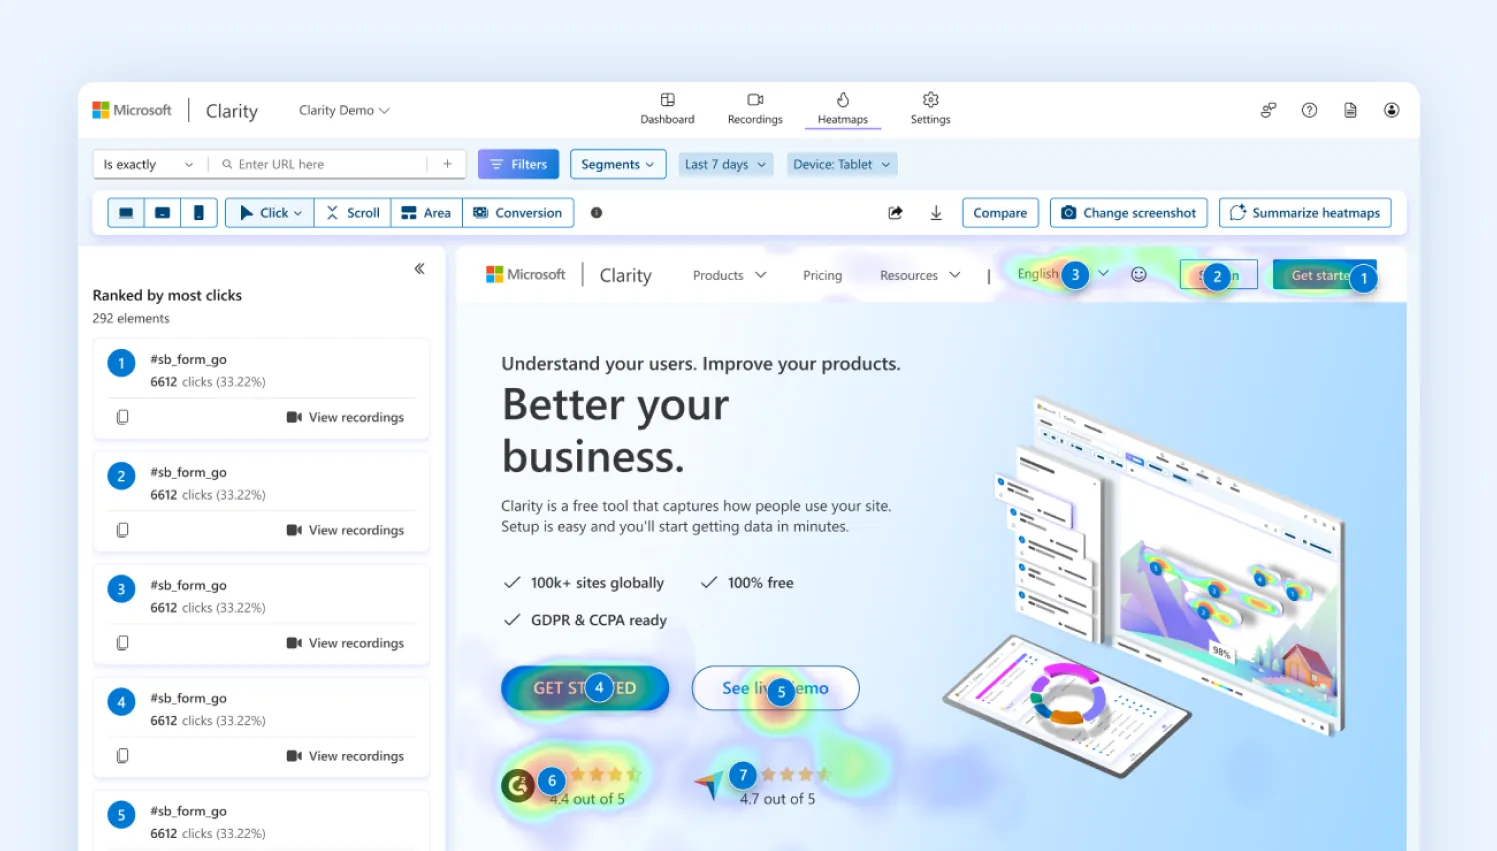
An example of a click heatmap, showing where visitors click on a page.
If there’s one behavioral analytics tool every e-commerce team should start with, it’s a heatmap. Not because it gives you all the answers — it doesn’t — but because it’s the fastest way to spot where customers are struggling without watching hundreds of individual sessions.
A heatmap combines the interactions of hundreds or thousands of visitors into a single visual view of your page. Instead of showing one customer’s journey, it highlights patterns.
You can immediately see which buttons attract attention, how far shoppers scroll, which content gets ignored, and whether visitors are interacting with your page the way you intended.
In our experience, heatmaps are most valuable on pages that influence purchasing decisions: product pages, category pages, landing pages, the cart, and even checkout.
They’re particularly useful when you already know a page isn’t performing well but don’t yet know where to start looking. Not every heatmap tells you the same story, which is why we rarely rely on just one view.
- Click heatmaps are usually where we start. They quickly reveal whether customers are interacting with your page the way you intended or getting distracted by elements that look clickable but aren’t.
- Scroll heatmaps help answer a different question: Are shoppers even seeing the content you’ve invested time creating? If shipping details, reviews, or trust badges sit below the point where most visitors stop scrolling, moving them higher delivers a bigger impact than rewriting the copy itself.
- Move or attention heatmaps (available in some tools) add another layer of context by showing where visitors spend the most time interacting with a page. We treat these as supporting evidence rather than definitive proof, but alongside click and scroll data, they often help explain why certain sections attract more attention than others.
The biggest strength of heatmaps is that they help you prioritize. Instead of asking, “What should we optimize next?”, they quickly highlight where customer attention and friction are concentrated.
What they don’t tell you is why people behaved that way. That’s where session recordings become a better tool.
What are session recordings?
If heatmaps tell you where to investigate, session recordings help you understand what actually happened. A session recording captures a real visitor’s journey through your store.
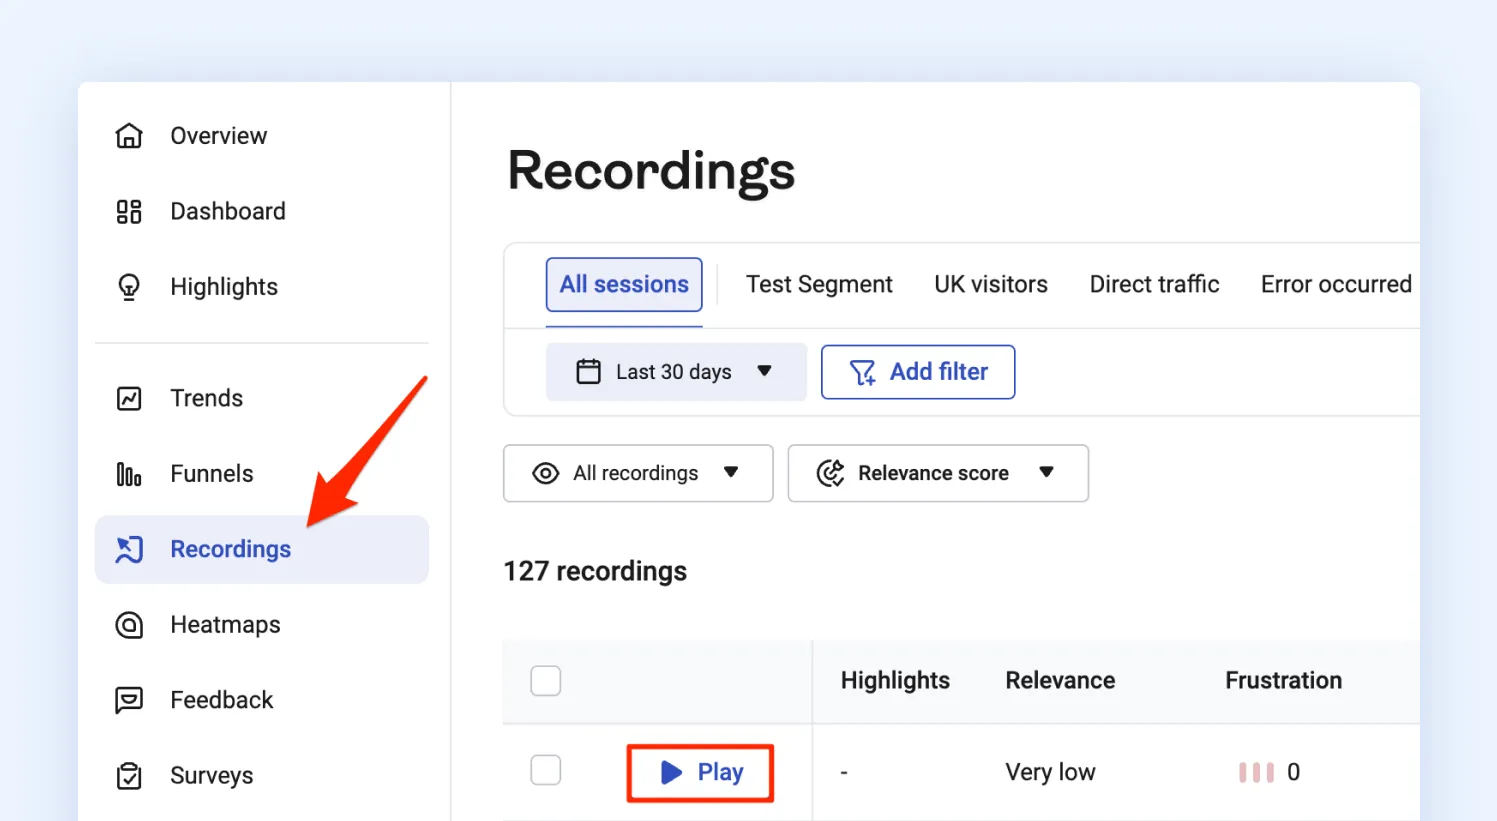
An example of a session recording dashboard, where you filter and replay individual visitor sessions.
You can see how they navigated between pages, where they paused, what they clicked, how they interacted with forms, and what happened immediately before they abandoned their session or completed a purchase.
This level of detail makes session recordings one of the most valuable tools for diagnosing conversion issues, but only when they’re used with a purpose.
One mistake we often see is merchants watching random recordings and hoping they’ll discover something interesting. In reality, that’s rarely an efficient use of time. Session recordings are far more effective when you already have a question to answer.
For example:
- Why are shoppers abandoning the cart after viewing shipping options?
- Why did mobile conversions drop after our latest redesign?
- Why are visitors opening the size guide but not adding products to their cart?
- Why are so many customers failing to complete checkout?
With a clear hypothesis, patterns become much easier to spot. You might notice shoppers repeatedly zooming in on product images because they can’t see enough detail.
You may find customers clicking a disabled button, struggling to select a product variant, or repeatedly correcting form fields during checkout. Sometimes the issue isn’t usability at all; it’s a JavaScript error or a third-party widget that fails to load for certain visitors.
The real difference between heatmaps and session recordings
While heatmaps reveal the pattern, session recordings explain the behavior behind it. Together, they give you a much more complete picture of how customers experience your store.
| Feature | Heatmaps | Session recordings |
|---|---|---|
| Unit of analysis | Many visitors, one page | One visitor, full journey |
| Answers | What is happening | Why is it happening |
| Best used for | Layout, CTA placement, above-the-fold decisions | Debugging friction, form issues, and abandonment causes |
| Time to insight | Fast — visual pattern, instant read | Slower — requires watching and filtering |
| Minimum data needed | High-traffic pages need real volume before patterns stabilize | Useful even with a handful of well-filtered sessions |
| Weakness on its own | Shows that users drop off, not the mechanism | Doesn’t scale — can’t represent hundreds of visitors at once |
| Setup complexity | Low — usually a single script tag | Low, but needs privacy masking configured before launch |
When to use each and when to skip both
Not every store is ready for either tool, and using them at the wrong moment is how most merchants end up with a dashboard nobody opens after month one.
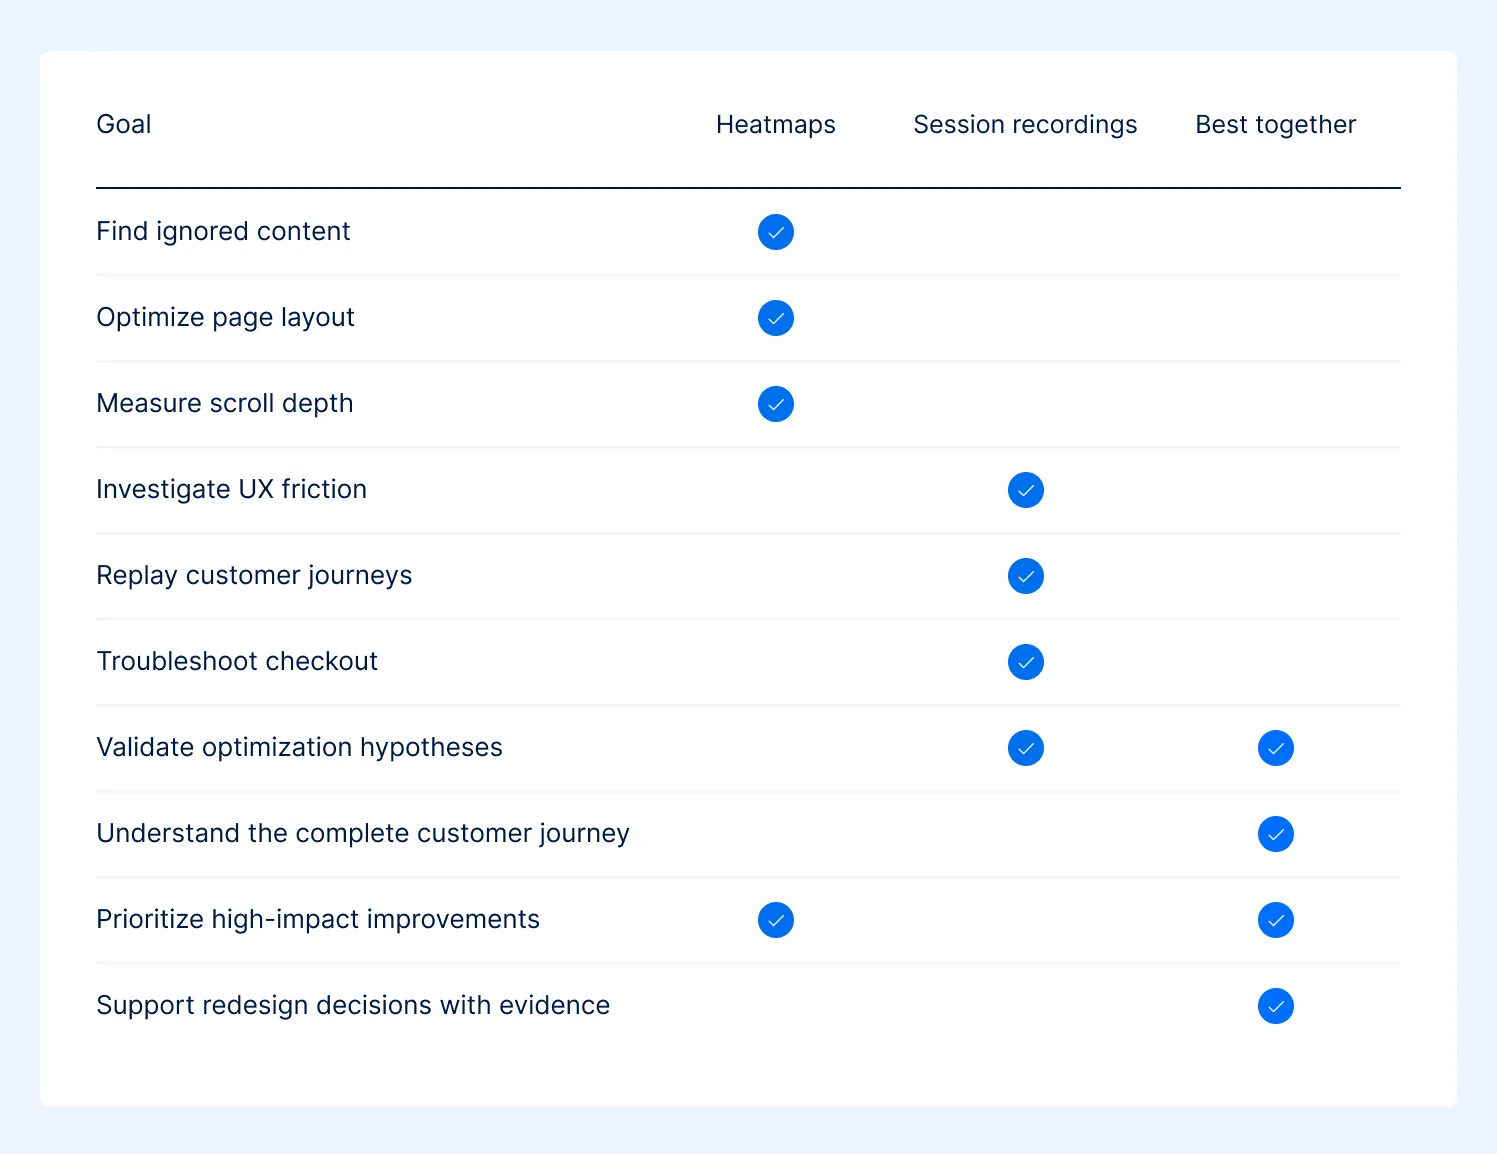
When to use heatmaps, when to use session recordings, and when to use both.
Choose heatmaps if:
- You’re deciding where to place a CTA, hero banner, or product recommendation and want a data-backed starting point
- You need to audit a page for dead zones or misplaced attention before a redesign
- You want a fast, visual gut-check across device types before committing developer time to a fix
Choose session recordings if:
- You already have a specific, reported problem — a support ticket, a checkout drop in your funnel report, a feature that “isn’t working”
- You need to see the exact field, click, or hesitation behind an abandonment number
- You’re validating whether a recent design or feature change is being used the way you intended
Use both together if:
- You’re running a full conversion audit on a high-traffic page and need both the pattern and the mechanism behind it
- You’re preparing a case for a larger redesign and need evidence a design team, developer, or stakeholder can’t easily dismiss
Look elsewhere — or wait — if:
- Your store doesn’t yet have the traffic to make a heatmap meaningful. Aggregate patterns on a homepage or product page typically need several thousand sessions before they stabilize; below that, you’re looking at noise dressed up as a pattern.
- You’re trying to diagnose a problem you haven’t defined yet. Watching recordings with no hypothesis is the single most common way merchants waste the first month with these tools — you need a heatmap, a funnel report, or a support ticket to tell you where to look first.
- The real issue is upstream of the page: a pricing problem, a shipping cost surprise, or a trust gap no layout change will fix. Recordings can show you customers hesitating, but they can’t tell you the hesitation is really about a $12 shipping fee that only appears at the final step. That diagnosis comes from combining recordings with checkout and funnel data, not from the replay alone.
How to use heatmaps and session recordings together
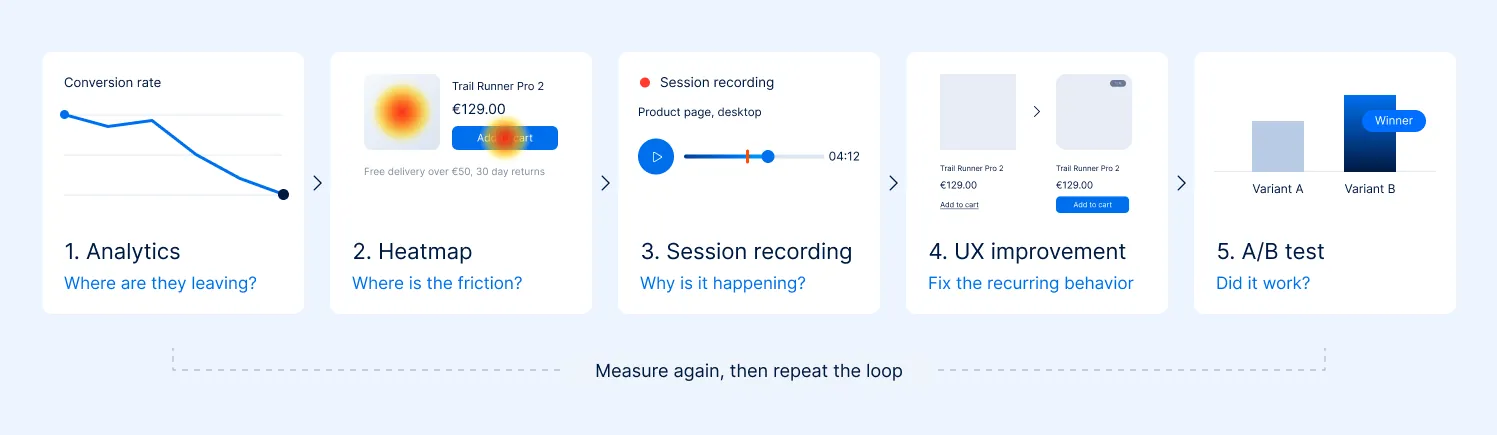
A typical e-commerce conversion optimization workflow, from analytics through to A/B testing.
One of the biggest mistakes we see is merchants jumping straight into session recordings. Watching random customer sessions might uncover something interesting, but it’s rarely the fastest way to identify a conversion issue.
A better workflow looks like this:
- Start with analytics. Use GA4 or your analytics platform to identify where customers are dropping off or where conversions are underperforming.
- Open the heatmap. Look for patterns. Are shoppers missing your CTA? Ignoring important content? Clicking on elements that aren’t interactive?
- Form a hypothesis. Turn those patterns into a question. Are visitors abandoning because shipping information is hard to find? Is the product gallery creating confusion?
- Review filtered session recordings. Watch recordings from the page or audience you’re investigating, not random sessions. Focus on visitors who abandoned, encountered errors, or followed the same journey.
- Make the change. Prioritize the fix that addresses the recurring behavior you’ve observed.
- Validate the outcome. Use A/B testing and your analytics platform to confirm whether the change actually improved conversions.
Rule of thumb: Use analytics to find the problem, heatmaps to identify patterns, session recordings to understand behavior, and A/B testing to prove your solution works.
Here’s how that sequence plays out in practice. Say a product page’s conversion rate drops from 3.4% to 2.1% over a few weeks. Analytics shows the exit rate climbing right after the image gallery.
A heatmap on that page confirms it: shoppers are clicking repeatedly on the product image itself, not just glancing at it. Filtered session recordings settle the question: visitors are trying to pinch-zoom into the image to inspect stitching, texture, or fit, and the image isn’t built to zoom.
That’s the fix. Add proper zoom functionality and a couple more detail shots to the gallery, validated afterward with an A/B test rather than shipped on the strength of the recordings alone.
Choosing the right heatmap and session recording tool
The most popular heatmap and session recording tools for e-commerce.
The right platform depends less on the heatmap itself and more on the workflows your team needs. If you’re simply trying to understand why customers abandon a page, almost any modern platform will help.
If you’re running ongoing experimentation across multiple teams, journey analytics, collaboration, and advanced segmentation become much more important. Here’s where the most popular tools fit.
| Tool | Best for | What we like |
|---|---|---|
| Microsoft Clarity | Stores getting started | Free, easy to implement, includes heatmaps, recordings, rage clicks, and dead clicks. It’s one of the best free behavioral analytics tools available. |
| Hotjar | CRO and UX teams | Combines heatmaps and recordings with surveys and user feedback, making it easier to understand both customer behavior and customer sentiment. |
| Contentsquare | Enterprise e-commerce | Excellent for journey analysis, segmentation, AI-powered insights, and cross-team collaboration. Better suited to large organizations than small stores. |
| FullStory | Technical investigations | Particularly strong at identifying frontend issues, JavaScript errors, and complex customer journeys that span multiple sessions or pages. |
| Lucky Orange | Growing stores | A good all-round option that combines behavioral analytics with live chat and visitor insights. |
How to use heatmaps and session recordings across the e-commerce customer journey
Not every page deserves the same level of analysis. If you’re trying to improve conversions, start with the pages that influence buying decisions, not the ones that simply attract traffic.
Here’s how we typically approach each stage of the customer journey.
| Journey stage | What we’re looking for | Best tool |
|---|---|---|
| Homepage | Can visitors immediately understand where to go next? Are hero banners and featured collections helping customers navigate or creating distractions? | Heatmaps |
| Category pages | Are shoppers using filters and sorting? Are they engaging with the products you expect, or skipping entire sections of the catalog? | Heatmaps + session recordings |
| Search results | Are visitors refining searches, abandoning after zero results, or repeatedly searching for products they can’t find? | Session recordings |
| Product pages | This is usually where we spend the most time. Are customers reaching reviews, shipping information, and trust signals? Are they interacting with product images, variant selectors, and the “Add to Cart” button as expected? | Heatmaps + session recordings |
| Cart | Are coupon fields distracting shoppers? Are customers repeatedly changing quantities or removing products before leaving? | Session recordings |
| Checkout | By this stage, persuasion matters less than usability. We’re looking for form friction, validation errors, payment failures, confusing shipping options, and anything that interrupts the purchase. | Session recordings |
| Post-purchase | Are customers engaging with upsells, loyalty programs, referral offers, or account creation opportunities? | Heatmaps |
If your resources are limited, don’t try to analyze everything at once. Prioritize pages that have the greatest impact on revenue:
- Checkout
- High-traffic product pages
- Category pages
- Cart
- Internal search
- Homepage
Fixing friction on a product page that thousands of shoppers visit every week will almost always deliver a greater return than optimizing a page that receives very little traffic.
When heatmaps and session recordings can mislead you
Behavioral analytics is incredibly useful, but it’s still just one piece of the puzzle. Without context, it’s easy to optimize for the wrong problem. Here are a few situations where experienced e-commerce teams pause before concluding.
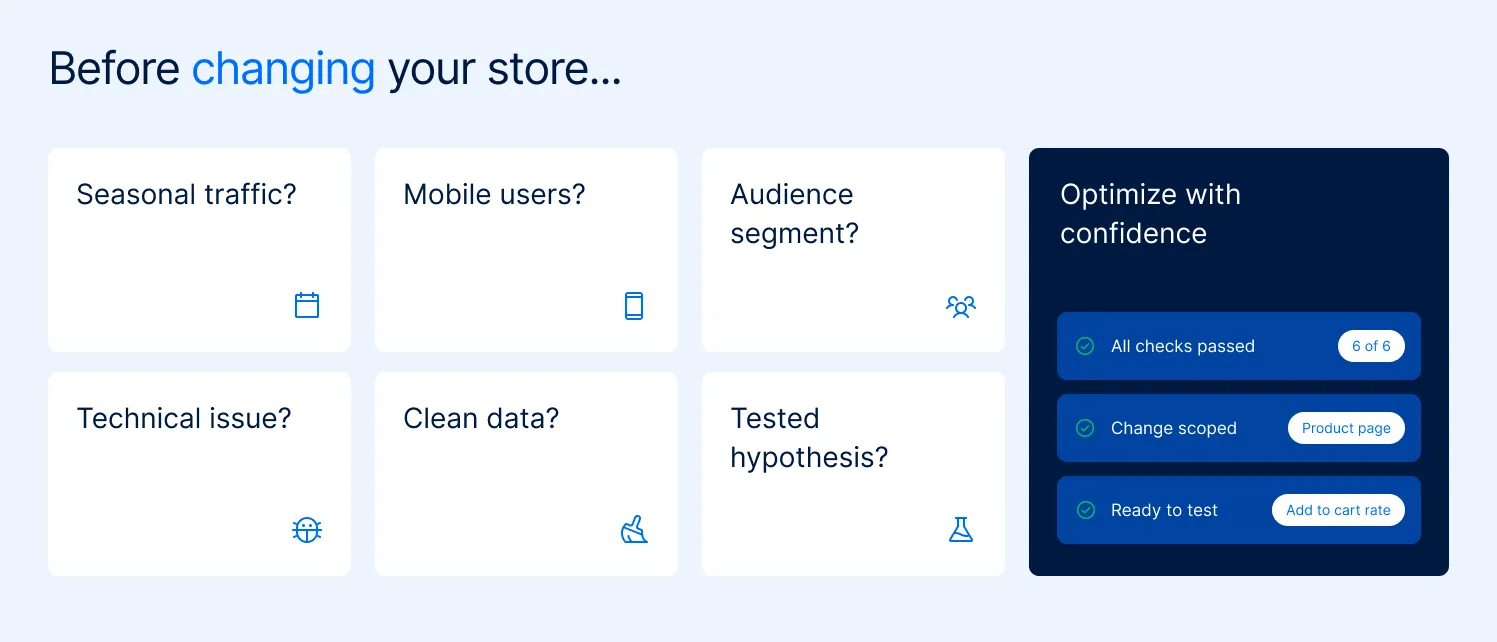
What to check before you act on heatmap or session recording data.
Seasonal traffic changes
Customer behavior during Black Friday, Cyber Monday, or holiday campaigns rarely reflects the rest of the year. A heatmap generated during a major promotion may show visitors interacting heavily with discount banners or limited-time offers that aren’t present during normal trading periods.
Looking only at desktop visitors
Desktop and mobile shoppers often behave very differently. Navigation patterns, scrolling behavior, and checkout interactions can change dramatically between devices. Before making design decisions, compare behavioral data across desktop, tablet, and mobile sessions.
Treating every visitor the same
A first-time visitor explores differently from a returning customer. Someone arriving from a paid ad may behave very differently from someone searching for your brand by name. Segmenting recordings and heatmaps by the audience often reveals insights that disappear when all visitors are grouped.
Assuming every rage click is a UX problem
Repeated clicks can signal frustration, but they don’t always point to poor design. Slow page loads, delayed JavaScript, third-party widgets, or intermittent frontend bugs can all produce rage clicks. Before redesigning a page, rule out technical performance issues.
Ignoring data quality
Bot traffic, internal testing, and QA sessions can distort heatmaps and recordings if they aren’t filtered out. Make sure you’re analyzing genuine customer behavior before investing time in optimization.
Replacing evidence with assumptions
Heatmaps and session recordings help explain customer behavior, but they don’t prove that a design change will improve conversions.
Every significant hypothesis should still be validated through A/B testing and measured against business metrics such as conversion rate, average order value, or revenue per visitor.
A quick note on privacy
Behavioral analytics shouldn’t come at the expense of customer trust. Before rolling out heatmaps or session recordings, verify that your implementation aligns with your consent management process and that sensitive information is masked.
Most leading platforms support these controls, but they’re not always enabled by default.
Take behavioral analytics further with AI
Heatmaps and session recordings are great at showing you what’s happening on your site, but making sense of all that data still takes time.
Microsoft Clarity’s official MCP Server lets you connect Clarity with AI assistants like Claude, so you can explore your analytics using plain English instead of digging through dashboards. Rather than manually filtering reports, you can ask questions like:
- Why are mobile visitors spending less time on this page?
- Show me session recordings from users who abandoned checkout.
- Compare engagement between paid and organic traffic.
- Summarize what changed over the past week.
Claude can quickly help you spot trends, surface relevant data, and point you toward the sessions worth reviewing. It won’t replace human judgment, but it can significantly reduce the time it takes to investigate UX issues and uncover opportunities for improvement.
We’ll walk through this workflow in more detail in our upcoming blog on using Microsoft Clarity with Claude through MCP.
Final thoughts
Every e-commerce team has access to more data than ever before. The challenge is understanding what it actually means.
Heatmaps help you identify where customers are engaging or struggling. Session recordings provide the context behind those behaviors. Used alongside traditional analytics, they make it easier to replace assumptions with evidence and prioritize improvements that have the greatest impact on the customer journey.
If you’re ready to uncover friction in your customer journey and turn those insights into higher conversions, contact Magebit. Our e-commerce experts help Shopify and Adobe Commerce merchants use behavioral analytics to build faster, more intuitive shopping experiences.